> ## Documentation Index
> Fetch the complete documentation index at: https://docs.codecrafters.io/llms.txt
> Use this file to discover all available pages before exploring further.
# How do I debug test failures in the Redis Challenge?
This is specifically for the Redis Challenge. For debugging test failures for common challenges, refer to our [guide](/challenges/debug-test-failures).
## Required Tools
The easiest way to debug problems with your redis implementation is to compare it to the official implementation. To do this, we'll need a few tools handy.
### redis-cli, redis-server
Make sure you have [redis-cli](https://redis.io/topics/rediscli) and [redis-server](https://redis.io/topics/quickstart#starting-redis) installed. We'll use redis-cli to test commands against your redis implementation, and redis-server as a reference to compare with.
### Wireshark
Since redis-cli & redis-server communicate with each over using TCP, we'll need a tool to inspect TCP messages. Install [Wireshark](https://www.wireshark.org/#download). If you prefer CLI tools you can also use **tcpdump**.
## Methodology
### 1. Setup Wireshark to capture and display TCP traffic
Run Wireshark and use `tcp.port == 6379` or `tcp.port == 6380` as a display filter. We'll use this in step 4 to view captured packets.
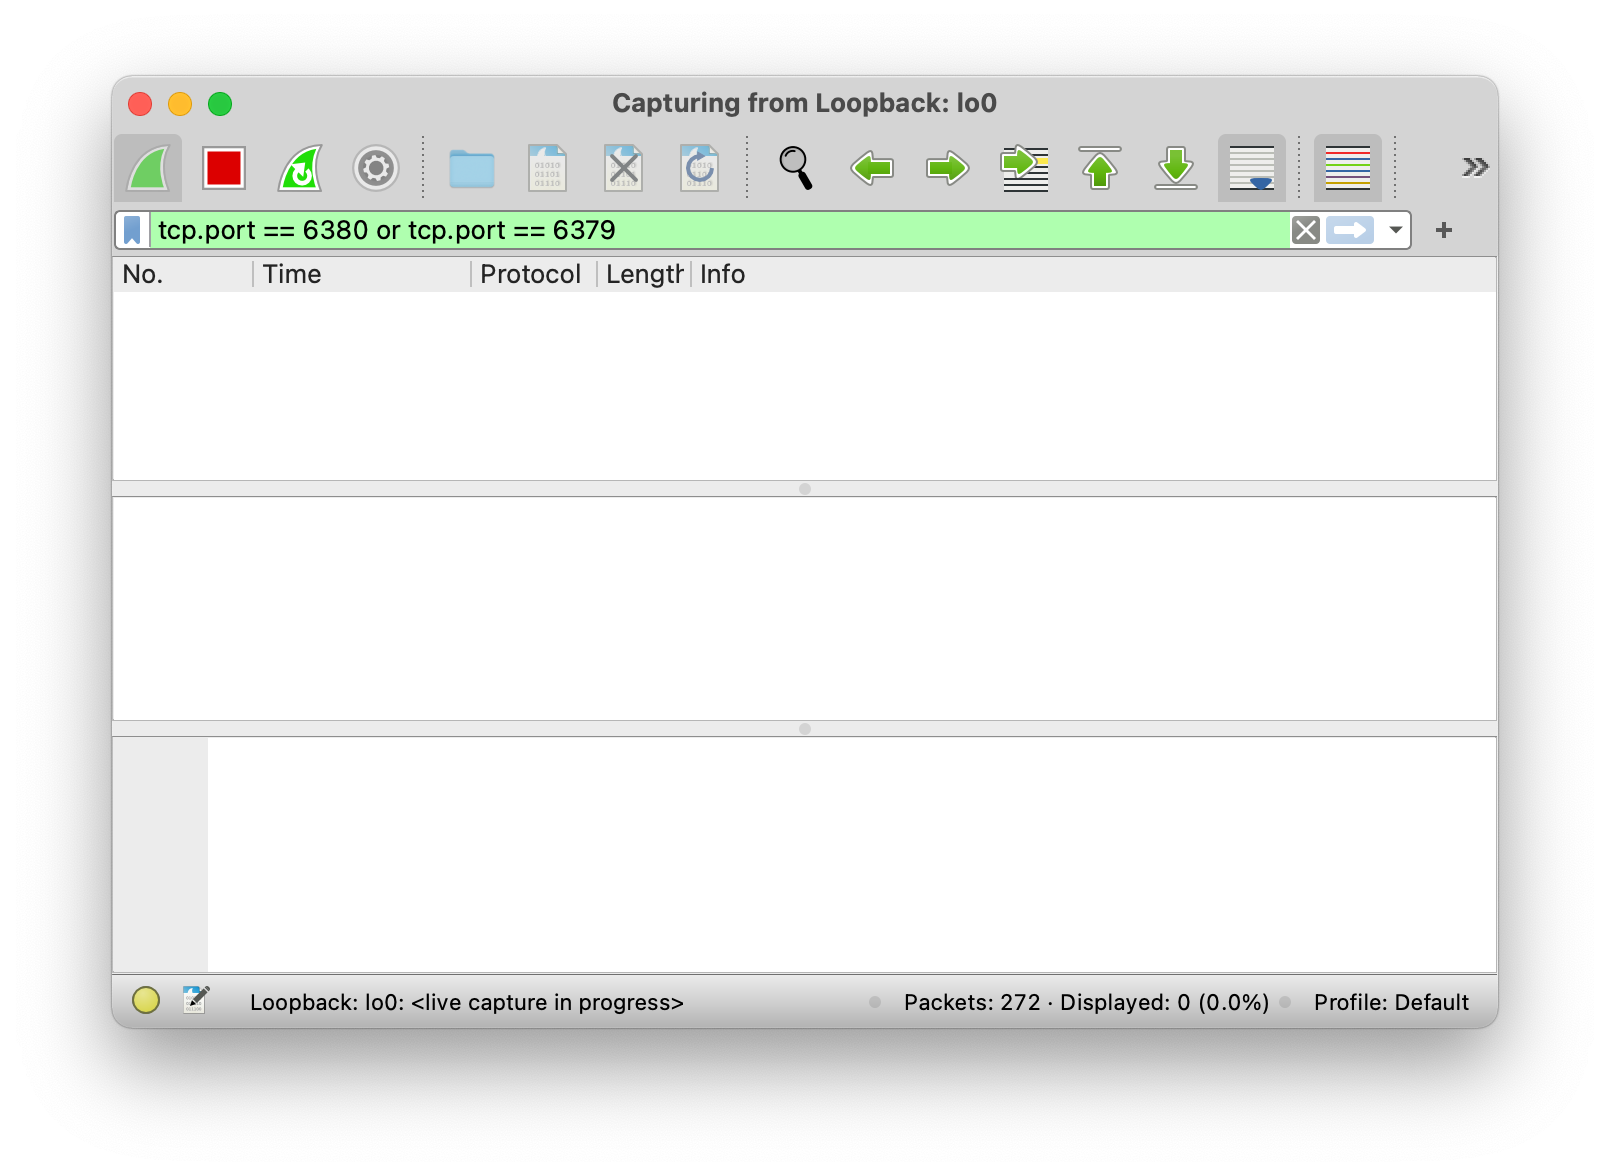 Make sure that the bottom toolbar says `Loopback: lo0`, and not something like `Wi-Fi: en0`.
#### Using tcpdump to capture and display TCP traffic
```bash terminal theme={null}
sudo tcpdump -i lo0 -X port 6379 or port 6380
```
Only root or user with sudo privileges can run tcpdump. See `man tcpdump` for more information.
### 2. Start your redis server implementation (on port 6379)
You'll find instructions for this in your repository's README (like [here](https://github.com/codecrafters-io/redis-starter-go#usage)). Your server will run on `port 6379`, which is the port we've configured Wireshark to capture data on.
### 3. Start the official redis server implementation (on port 6380)
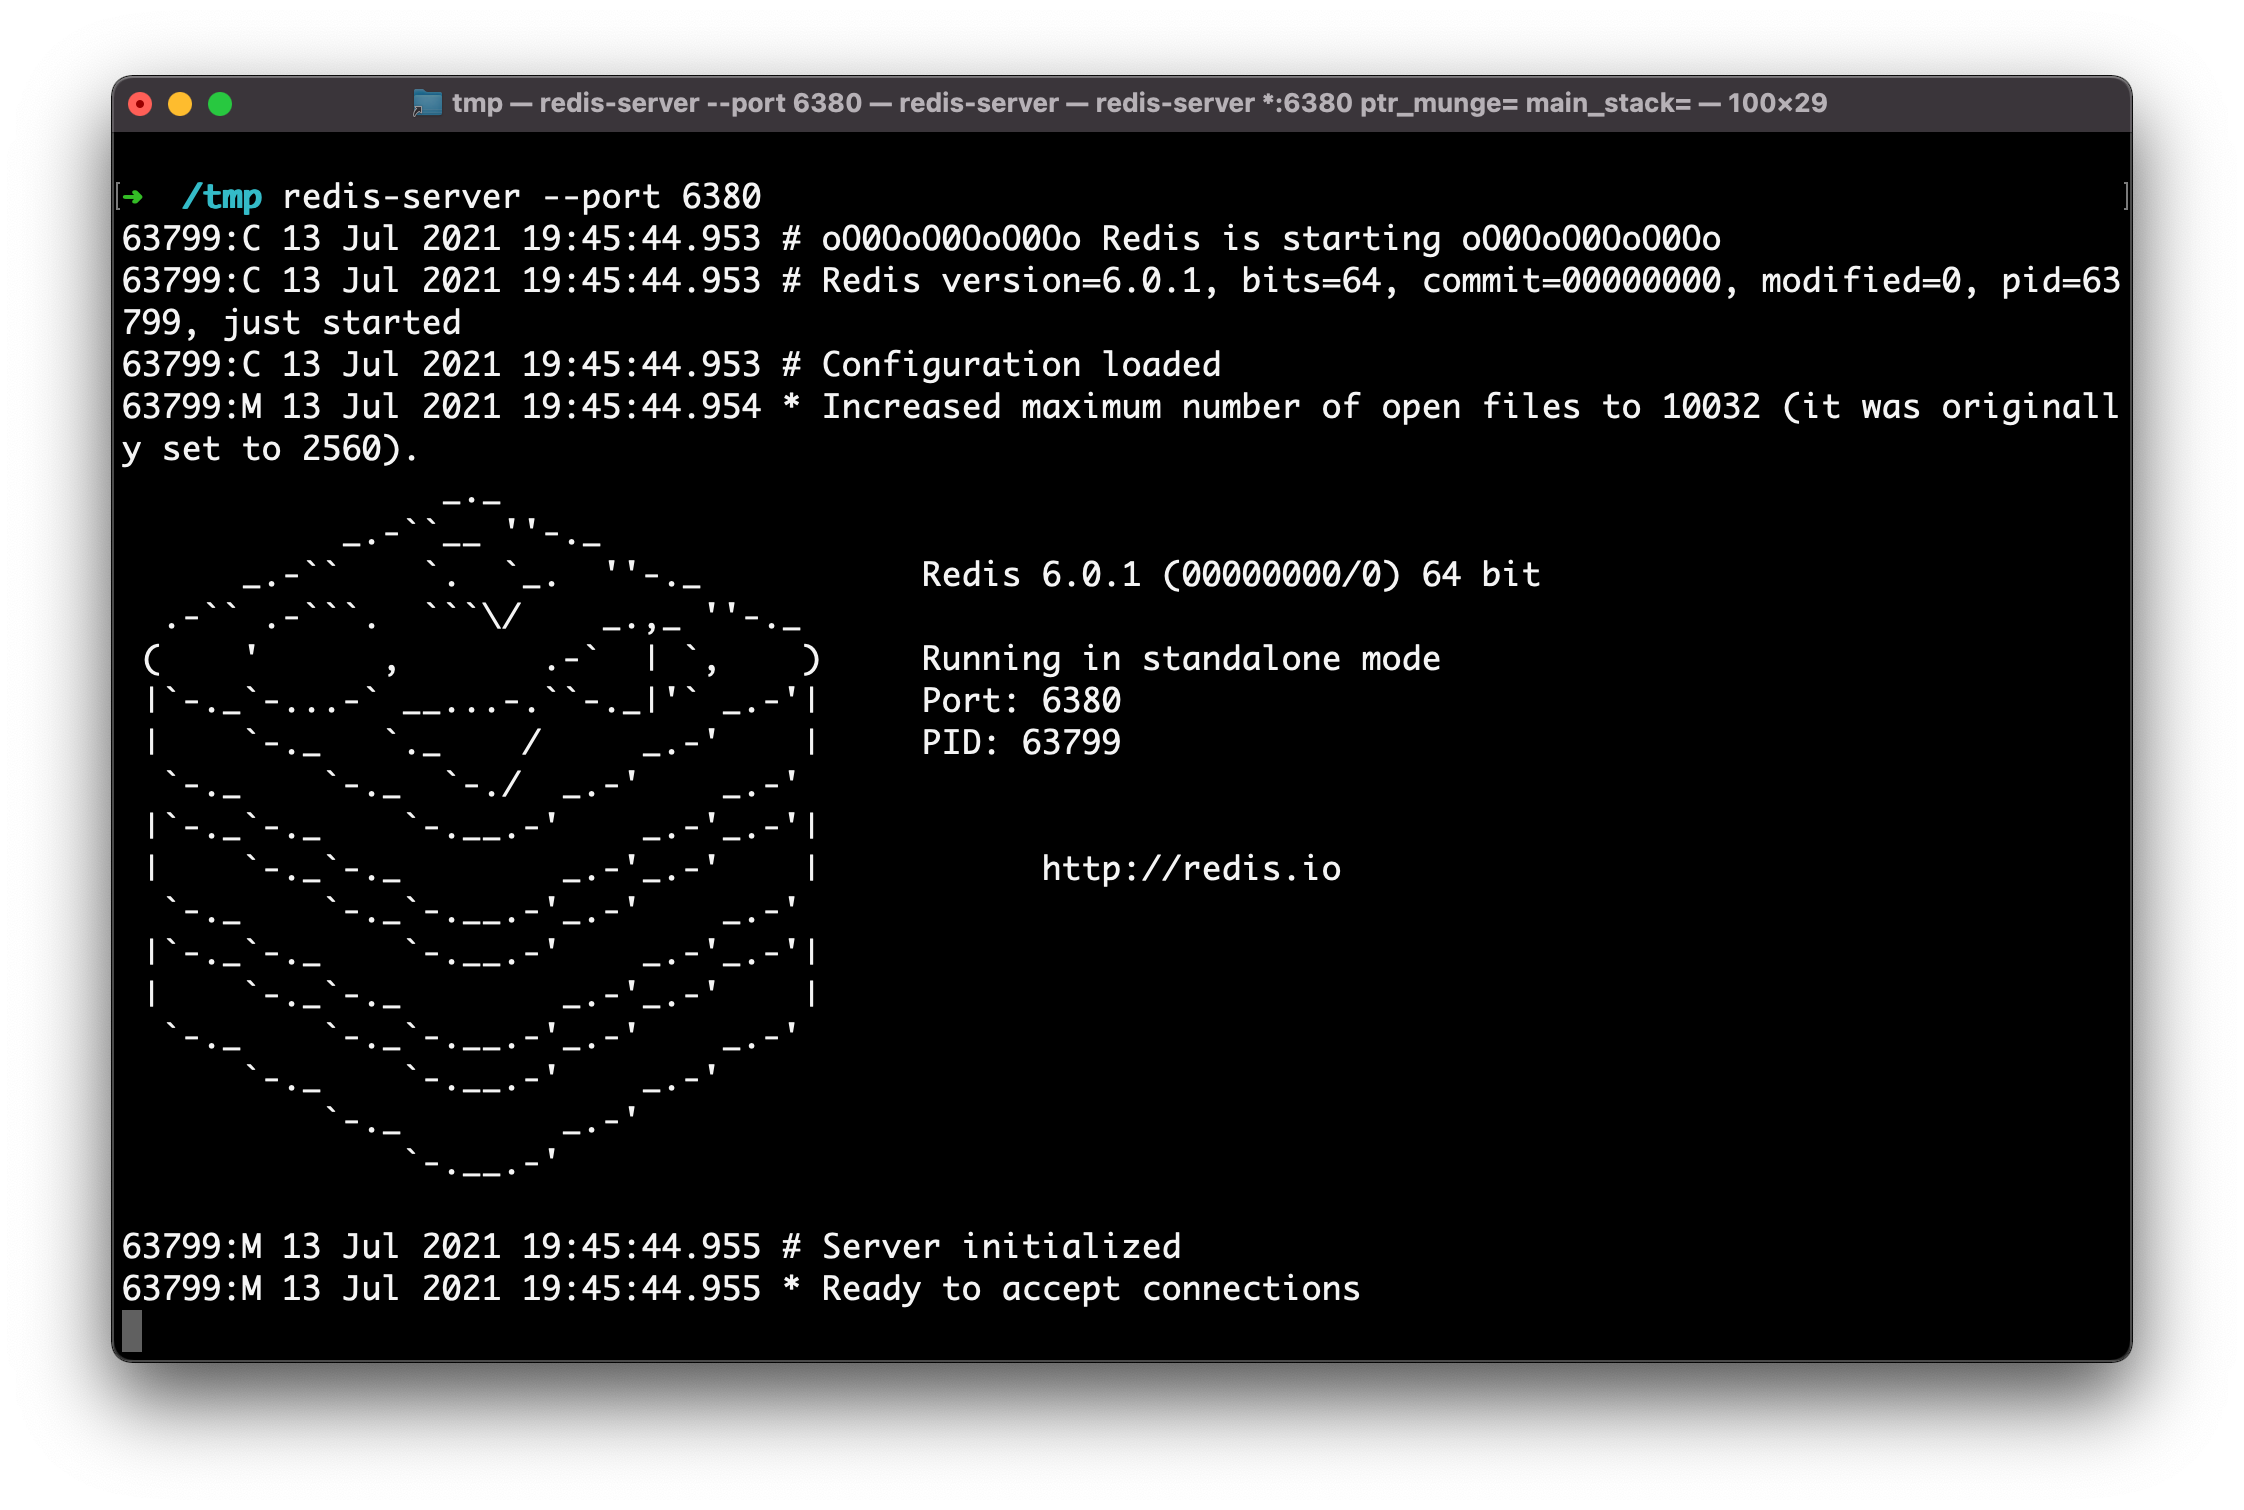
Run `redis-server --port 6380` to do this.
Make sure that the bottom toolbar says `Loopback: lo0`, and not something like `Wi-Fi: en0`.
#### Using tcpdump to capture and display TCP traffic
```bash terminal theme={null}
sudo tcpdump -i lo0 -X port 6379 or port 6380
```
Only root or user with sudo privileges can run tcpdump. See `man tcpdump` for more information.
### 2. Start your redis server implementation (on port 6379)
You'll find instructions for this in your repository's README (like [here](https://github.com/codecrafters-io/redis-starter-go#usage)). Your server will run on `port 6379`, which is the port we've configured Wireshark to capture data on.
### 3. Start the official redis server implementation (on port 6380)
Run `redis-server --port 6380` to do this.
 **Send a few commands to your server using redis-cli.**
Use redis-cli to send commands to your server.
```bash Terminal theme={null}
redis-cli -p 6379 ping
```
```bash Terminal theme={null}
redis-cli -p 6379 echo key
```
**Note**: You can also use the redis-cli [interactive mode / REPL](https://redis.io/topics/rediscli#interactive-mode), but keep in mind that it sends a [COMMAND](https://redis.io/commands/command) command when it boots, which we don't implement in the Redis challenge.
If your redis implementation doesn't send a valid response, you might see an error like this:
**Send a few commands to your server using redis-cli.**
Use redis-cli to send commands to your server.
```bash Terminal theme={null}
redis-cli -p 6379 ping
```
```bash Terminal theme={null}
redis-cli -p 6379 echo key
```
**Note**: You can also use the redis-cli [interactive mode / REPL](https://redis.io/topics/rediscli#interactive-mode), but keep in mind that it sends a [COMMAND](https://redis.io/commands/command) command when it boots, which we don't implement in the Redis challenge.
If your redis implementation doesn't send a valid response, you might see an error like this:
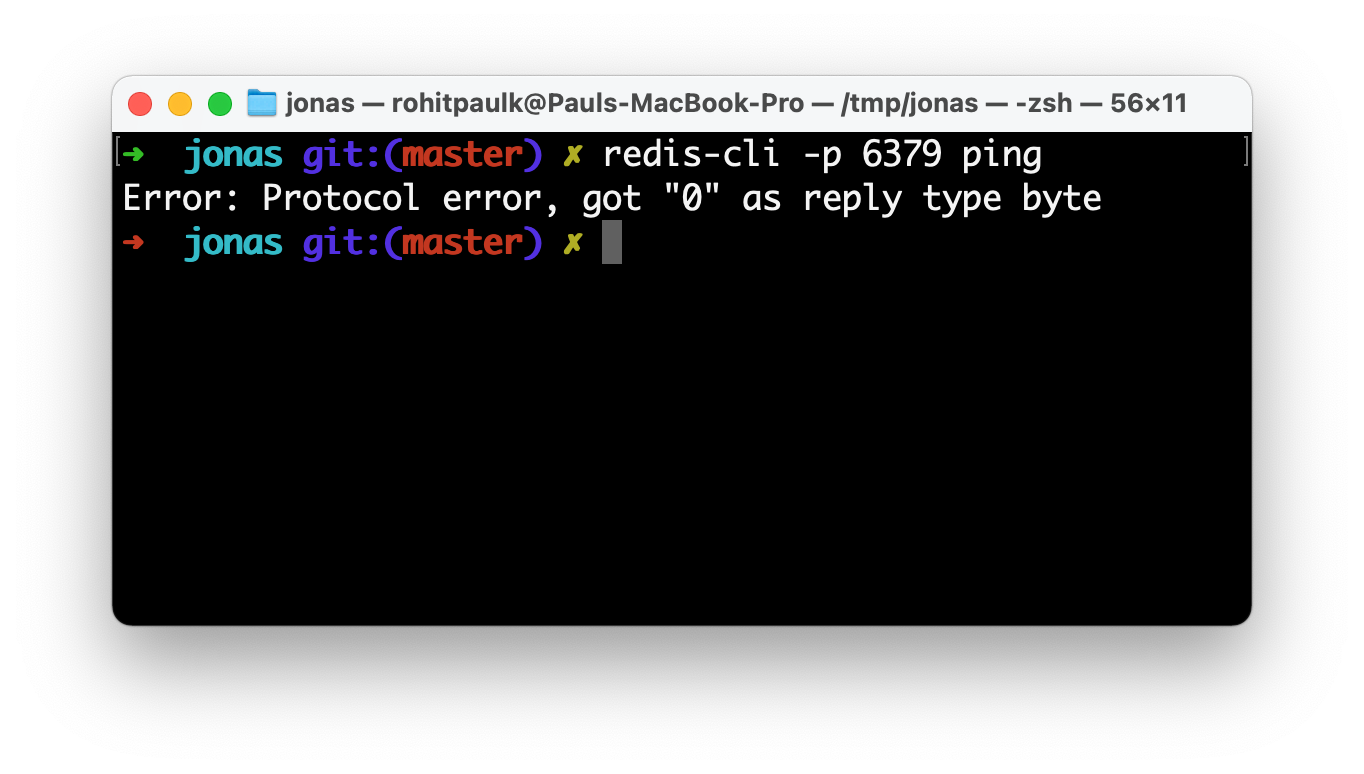 These error messages can be cryptic, and in some cases the Redis client might just hang waiting for bytes that never arrive.
### 4. View capture data in Wireshark
Once you've sent a few commands, head back to Wireshark and you'll now see some captured packets. You can inspect these to see exactly what data your implementation responded with.
These error messages can be cryptic, and in some cases the Redis client might just hang waiting for bytes that never arrive.
### 4. View capture data in Wireshark
Once you've sent a few commands, head back to Wireshark and you'll now see some captured packets. You can inspect these to see exactly what data your implementation responded with.
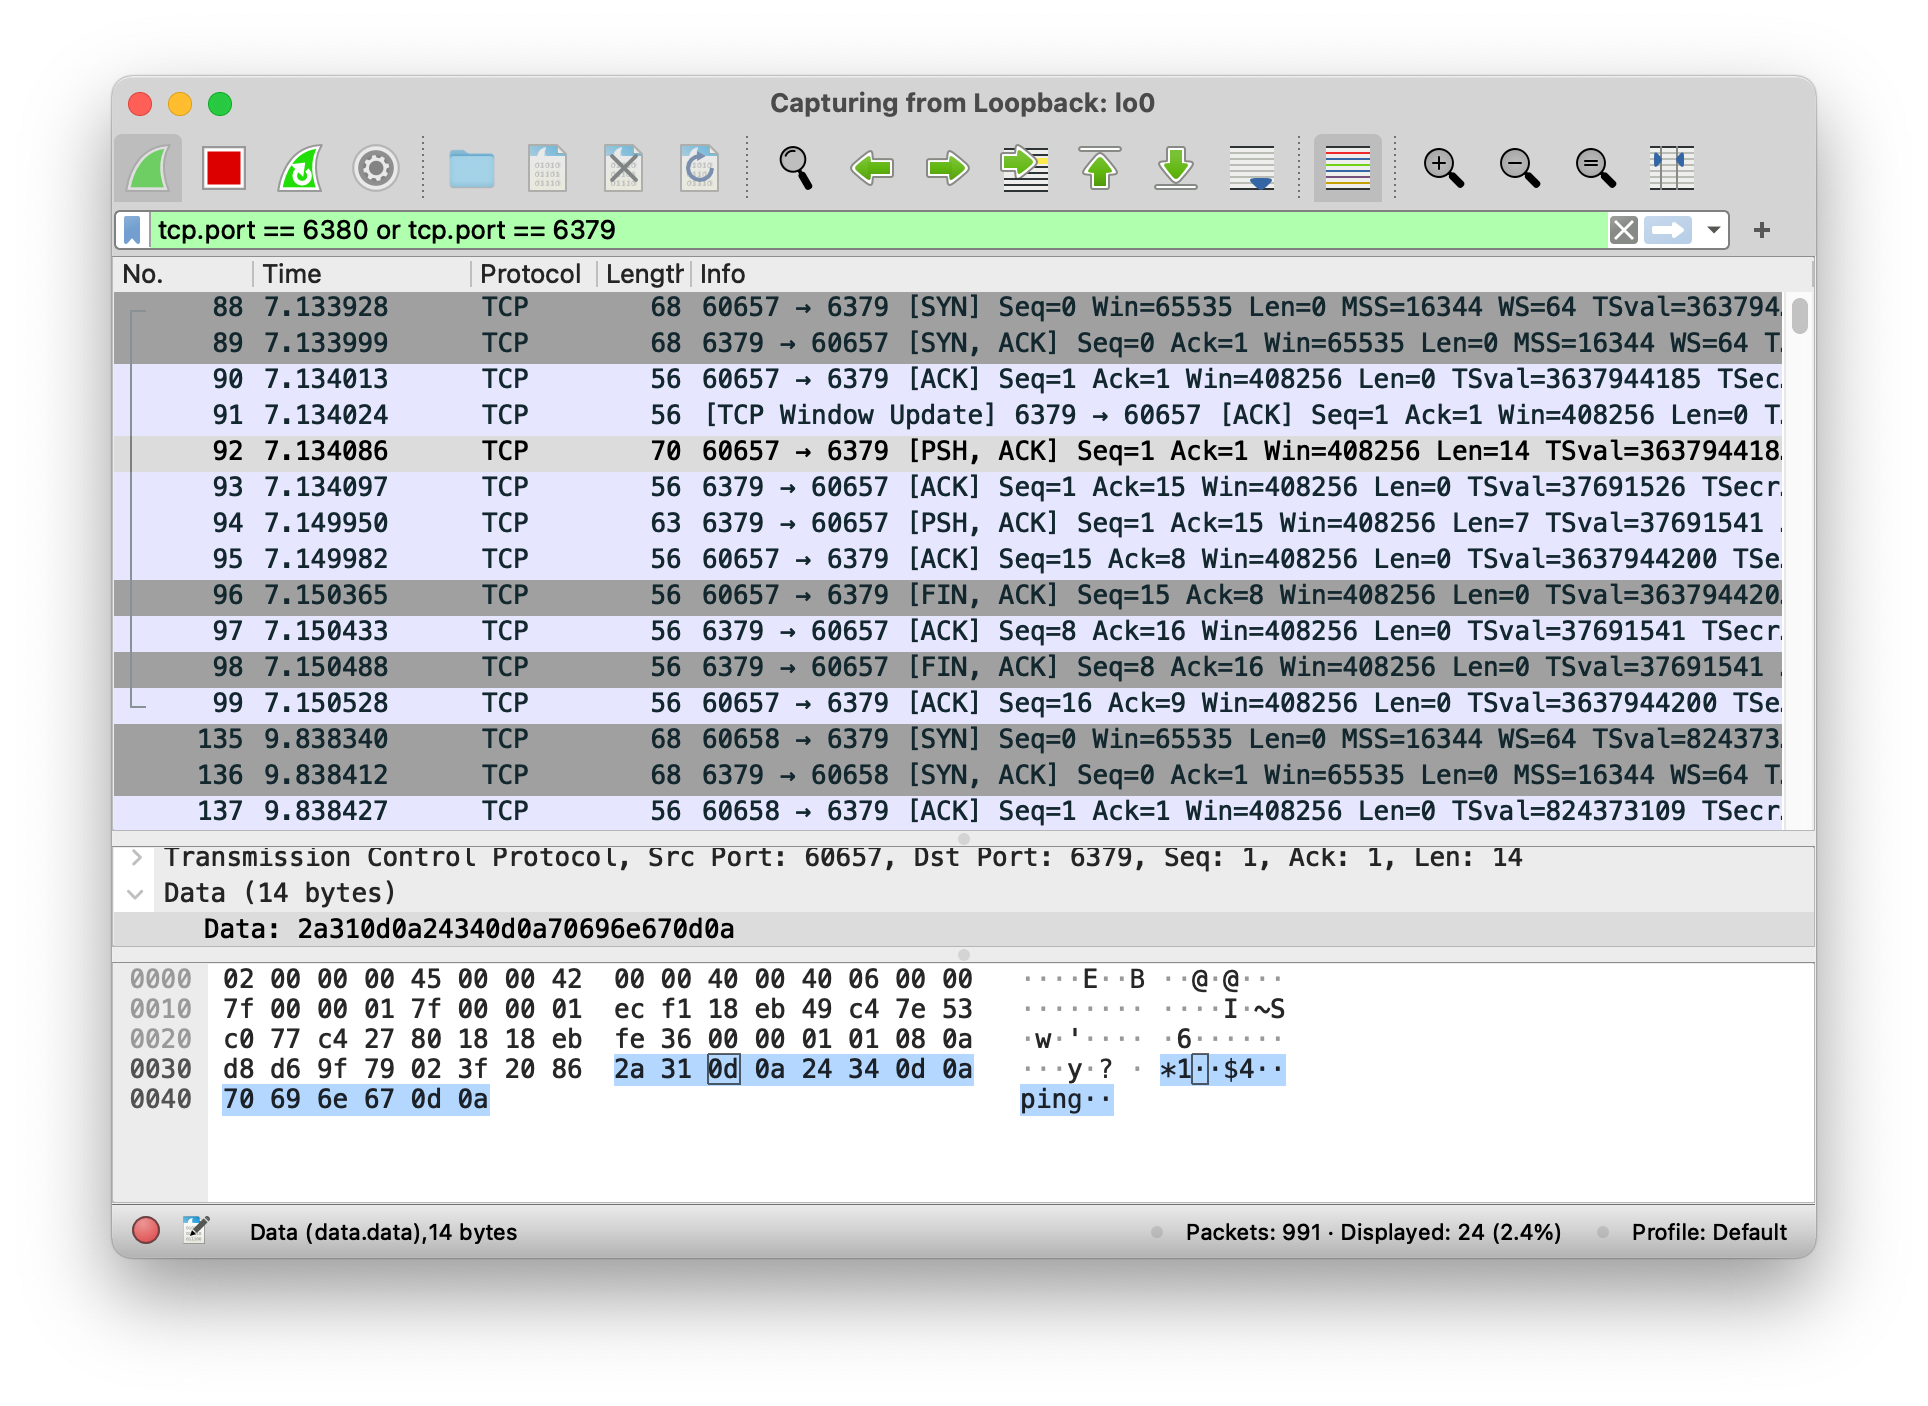 Notice the "\*1 \$4 ping" at the bottom? That's the PING command, encoded using the [Redis protocol](https://redis.io/topics/protocol).
#### View capture data from tcpdump
tcpdump can output all the same information as Wireshark. For example, when sending the PING command, look for `$4..PING..` and `+PONG..` in the captured data.
### 5. Compare with official redis implementation
Now that you know exactly what data your Redis server is sending, you can compare it with the official redis implementation to verify that it is working properly.
Send commands using `redis-cli -p 6380 `.
Notice the "\*1 \$4 ping" at the bottom? That's the PING command, encoded using the [Redis protocol](https://redis.io/topics/protocol).
#### View capture data from tcpdump
tcpdump can output all the same information as Wireshark. For example, when sending the PING command, look for `$4..PING..` and `+PONG..` in the captured data.
### 5. Compare with official redis implementation
Now that you know exactly what data your Redis server is sending, you can compare it with the official redis implementation to verify that it is working properly.
Send commands using `redis-cli -p 6380 `.
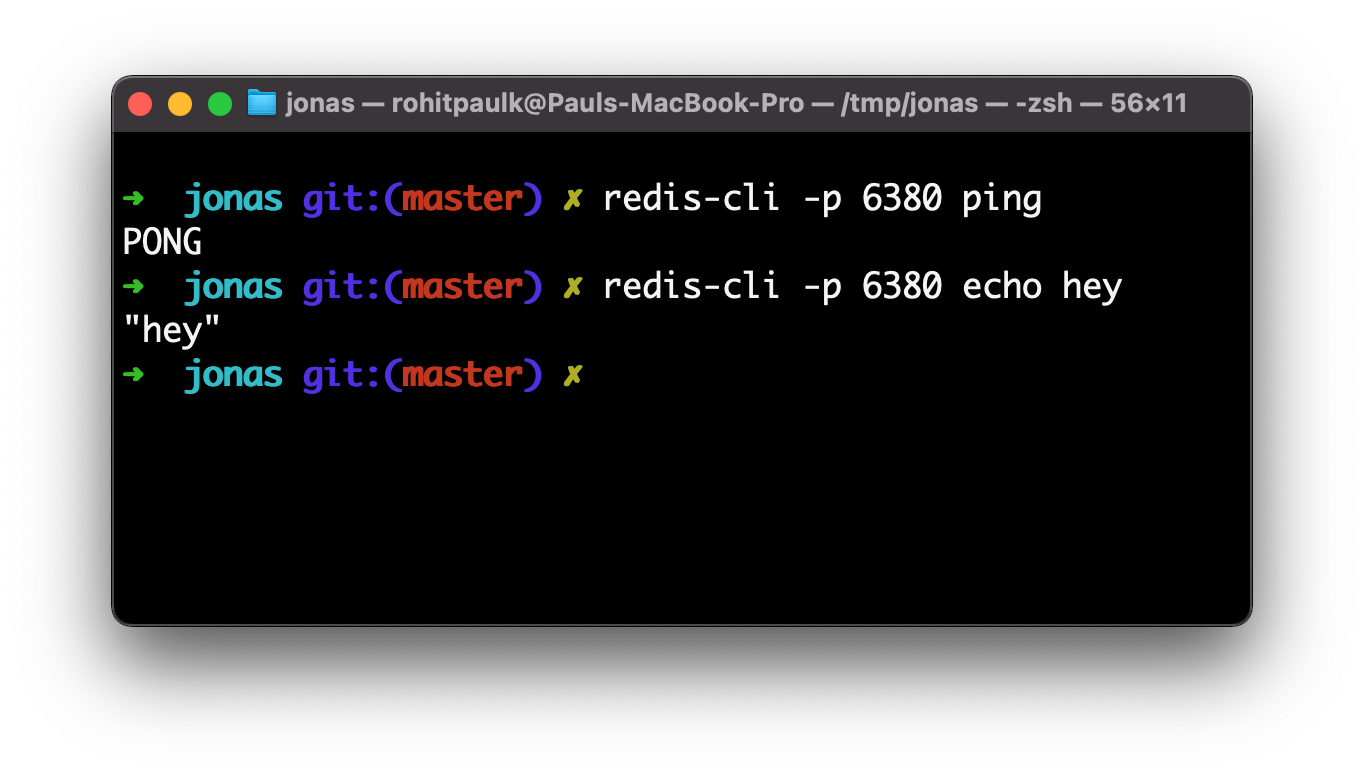 Inspect the output in Wireshark (as mentioned in step 4) to see how the official Redis implementation differs from yours.
***
If everything seems correct and you're still seeing test failures, it's possible that the Codecrafters tester program is at fault. Please let us know at [hello@codecrafters.io](mailto:hello@codecrafters.io) if that's the case!
Inspect the output in Wireshark (as mentioned in step 4) to see how the official Redis implementation differs from yours.
***
If everything seems correct and you're still seeing test failures, it's possible that the Codecrafters tester program is at fault. Please let us know at [hello@codecrafters.io](mailto:hello@codecrafters.io) if that's the case!